Understanding Texts Through Visualisation
Michael Barlow [1]
Rice University
Proposal
Visualisation techniques, from the use of tables and graphs to more
sophisticated three-dimensional abstract representations, are common in the
scientific and engineering disciplines. Within the humanities, there is a
tradition of research on images evoked by texts and images associated with texts, but
not on visualisation of texts themselves. I see no fundamental reason why
specialised visualisation tools should not be developed for use on data (i.e.,
raw or annotated texts) in the humanities and related disciplines in order to
advance the study of texts and cultures. I wish to
explore what is meant by, and what can be gained through, the use of techniques
of text visualisation. As I
illustrate below, visualisation has the potential to support interpretative
scholarship by pinpointing particular hot spots within a large data pool and by
providing visual 'maps' of a text which highlight particular elements or
relationships of interest. I expect the outcome of my fellowship to be a review
paper (and material for a book). In addition, I will address the role of
visualisation of texts in the humanities by creating software tools that
provide different 'views' of a text. During the semester of the fellowship,
these tools will be experimental in nature, but following on from my
research I will create a visualisation package for use by scholars who work on
text interpretation.
Visualisation is a broad topic and in the following few pages I will
try to illustrate and define the areas I wish to focus on by giving examples
and discussing the aspects of text visualisation that I will explore. There
have been individual visualisation projects in the humanities, notably Bradley
and Rockwell [2] (HumeŐs
Dialogues); Rohrer, Ebert and Sibert (The
Shape of Shakespeare); and Unsworth, Parker and Ancona (DanteŐs Inferno), but what I wish to
investigate is the appropriate form and function of a general visualisation
tool that can be applied to any text. [3]
Humanities scholars working on concordances and similar analyses have
long been concerned with the best way of generating analysis data based on
texts[4]. These scholars
and others, myself included, have found it informative to, in effect, rip texts
apart digitallyŃto put them in a centrifuge and see which text patterns are
rare (e.g., words occurring only once, hapax
legomena) and which are frequent. The results of this ŇrestructuringÓ of
the text (the wordlists and concordances) are clearly useful and have been the
basis of innumerable scholarly works on a variety of aspects of language and
culture, and yet, at the same time, there is a desire not only for the sorted
'mash' in the centrifuge, but also for the original story, for the text as a
whole. Luckily, since we are working within a digital universe, we can
potentially have both at the same time, namely, the results of restructuring as
well as the whole text. From a technical viewpoint we can have both, but we
still need to work out how to relate these two views in a way that is useful to
a wide range of scholars working with texts in the humanities.
Many concordance programs do, of course, provide both views, but they
do so in a limited sense. For example, I can use my concordance program, MonoConc (Barlow 2000)[5] to
find (and sort in various ways) all instances of the word pitee (pity) in the Canterbury Tales, as shown in the screen
shot below. (In actual use, many more concordance lines would be displayed.)
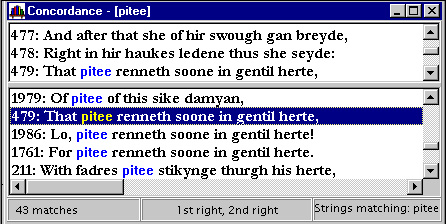
Figure 1: Concordance results and context window
The concordance lines are connected to the text to the extent that if I
click on a particular instance of pitee,
line 479 above, then the word is highlighted within a fairly large section
(15K) of the original text, part of which shows in the upper context window. In
the screen shot above, only three lines of this context is visible, but the
user could scroll through many lines of the surrounding context, and with some
programs the user can view the complete contents of the original file. Using
this same program, I can also examine the distribution of the word pitee throughout the Canterbury Tales, as shown below.
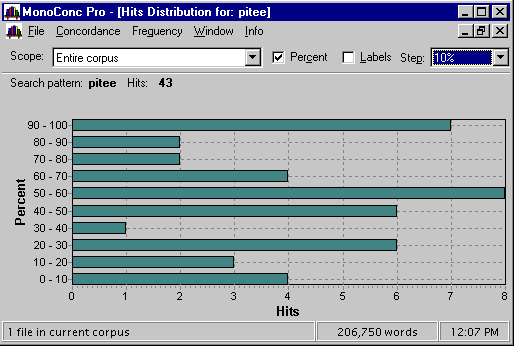
Figure 2: Distribution of instances of pitee in Canterbury Tales
In this chart the y-axis represents the whole of the text divided into
segments, each segment comprising, in this example, 10% of the text. For each
of these sequential segments, the number of finds or hits (of pitee) is displayed, allowing us to see
easily that there is only one instance of pitee
in the fourth segment, but eight instances in the sixth segment. In this example, the distribution tracks a single word, but it is possible to search for several words and plot their combined distribution in order to get a sense of the use of "themes" within a text.
From the two screen shots above, we can see that the program presents
three views of the text: (i) the concordance lines; (ii) the (large) context
for each concordance line, available on demand; and (iii) the chart showing the
distribution of the instances through the text. Since I designed this software,
I obviously think that this is a useful way of working with a text, but there
are alternatives, given current technology, which I would like to explore
during a fellowship semester. I do not plan to add a visualisation component to
MonoConc; rather I aim to explore completely new
approaches and new tools that apply visualisation techniques to the study of
texts.
One question to consider is the following: Is it possible to adopt
alternative visualisations that combine both search results and the text in a way that goes beyond the provision of a context of variable size for individual results? One
problem with the representation above is that although we can search for
multiple items, the relation of individual items to the text as a whole can no
longer be discerned. It would be beneficial to be able to search for several
distinct items simultaneously and see how they are distributed throughout the text
and in relation to one another.
Let me give a couple of examples of the sort
of approach I might adopt. I have produced a mock-up of a search for two-word
alliterations and three-word alliterations in the Canterbury Tales. The two searches, both represented simultaneously
in the illustration below, are distinguished by colour. The user can switch between
a reduced view of the text (shown here in the background) and a close-up view,
which shows the search results in the context of the text itself. In this
example, the two search items are phrases, the two and three word alliterative
sequences, but more generally the search items may be either two or more
words/phrases, or else a mixture of words/phrases and textual features such as division into chapters indicated by mark-up.
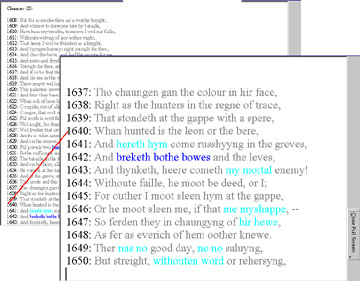
Figure 3: Text and detail views of alliteration in Chaucer
A basic concordancer such as MonoConc
responds to word/phrase queries entered by the user. Essentially, the user can
only issue one type of command: show me
all strings of characters of the pattern X (where X is the word pitee, for example). This is the engine
that drives the program and all the display frills are built on this procedure.
I would like to create a program that is built on a fundamentally different
command: not Ňshow me all strings X,Ó but rather transform yourself to show Y (where Y is the set of two or three
word alliterations, for example). Another example would be a command to show
all the hapax legomena in the Canterbury Tales. The result for The YeomanŐs Portrait would then look
like the following.
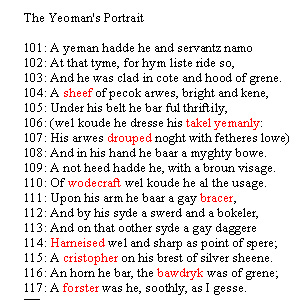
Figure 4: View of text (Yeoman's Portrait) and results (hapax legomena)
This example works quite well; we have the results and the text
combined in one view. (I assume that separate views may also be appropriate for
some purposes.)
More complex transformations of the text may be useful in locating
patterns or in identifying areas of interest to the scholar. Below, in another
mock-up, I have used colour to indicate the part-of-speech of words in a part
of CSCŐs call for proposals.
Key: noun adjective verb adverb
The CSC Mission:
The Center exists
to promote the study
of cultures across time
and around the world, both as unique examples of
human behavior
and creativity and as interconnected
phenomena, which can
illuminate one another. The goal of the Center is to provide a forum for the comparative and interdisciplinary conversations that make visible the connections among cultures and the particularities that divide them. The Center seeks to advance humanistic knowledge both by supporting research that deepens our understanding of particular cultures, and by encouraging the exploration of new configurations
of materials, methods, theories, or cultures through interdisciplinary and comparative collaborations.
A further transformation provides a rather different view where the
individual letters are indistinguishable, but the part-of-speech coding can be
seen. This view reveals the preponderance of adjectives and nouns in this text,
which is indicative of the high information load of academic discourse. In
contrast, we see the representation of a spoken dialogue among academics, which
contains fewer complex nouns and many more verbs and adverbs.
Key: noun adjective verb adverb
Written passage:
●●● ●●● ●●●●●●●
●●● ●●●●●●
●●●●●●
●● ●●●●●●●
●●● ●●●●●
●● ●●●●●●●●
●●●●●● ●●●●
●●● ●●●●●●
●●● ●●●●●
●●●● ●● ●●●●●●
●●●●●●●●
●● ●●●●●
●●●●●●●●
●●● ●●●●●●●●●●
●●● ●● ●●●●●●●●●●●●●●
●●●●●●●●●
●●●●● ●●●
●●●●●●●●●●
●●● ●●●●●●●
●●●
●●●● ●●
●●● ●●●●●● ●● ●● ●●●●●●● ● ●●●●●
●●● ●●● ●●●●●●●●●●●
●●● ●●●●●●●●●●●●●●●●● ●●●●●●●●●●●●●
●●●● ●●●●
●●●●●●●
●●● ●●●●●●●●●●●
●●●●● ●●●●●●●●
●●● ●●● ●●●●●●●●●●●●●●●
●●●● ●●●●●●
●●●●
●●● ●●●●●● ●●●●● ●● ●●●●●●● ●●●●●●●●●● ●●●●●●●●●
●●●● ●● ●●●●●●●●●● ●●●●●●●●
●●●● ●●●●●●●
●●● ●●●●●●●●●●●●● ●● ●●●●●●●●●● ●●●●●●●●●●●
●● ●●●●●●●●●●●
●●● ●●●●●●●●●●● ●● ●●● ●●●●●●●●●●●●●●
●● ●●●●●●●●● ●●●●●●● ●●●●●●●● ●● ●●●●●●●●
●●●●●●● ●●●●●●●●●●●●●●●●●
●●● ●●●●●●●●●●● ●●●●●●●●●●●●●●
Spoken dialogue:
a: ● ●●●●●
●●●● ●●
●●● ●●●●●●●●
●●● ●●●●● ●● ●●●●● ●●●●
●●●●●●●●●●
●● ●●● ●●●●
●●●●●●●●●
●●●● ●● ●●●●●
●●●●●●
●●●● ●●●●●●● ●●●●●●●●●
●● ●●● ●●●●● ●●●●●
●●●●
b: ●●●●
a: ●●●
b: ●● ●● '●● ●●● ●●●●●●
●●●● ●●●●●
●●●
●●●● Đ
a: ●●
●●● ●●●●●
●●●●●●
●●● ●●●●●●●●●
●● ●●● ●●●●
●●●●
●●●
b: ●●●●
●●●● ●●●
●● ●●●●●●●●
This example can be seen as a combination of the text merged with
information from selected mark-up, in this case, part-of-speech tags, which I
hope is informative for some and suggestive as a methodology for others.
Designing graphical views of texts such as these leads naturally to a
discussion of the appropriateness and usefulness of different ways of
graphically representing textual information. The purpose of visualisation
according to Card, Mackinlay and Shneiderman (1999:6) is 'to aid analysis and
facilitate discovery, decision-making, and explanation.' For the CSC project I
aim to explore what insights can be gained by providing visualisations of a
text either to rapidly locate areas of interest within the text, which will
then perhaps be analysed in traditional ways, or to provide views of a text
permitting new conceptualisations which would be difficult to arrive at by
other means.
I am confident about the first of these two uses of visualisation. The
human visual system is designed in a way that makes us far better at scanning a
visual representation than a text. The more data points there are, the greater
the need for a visual representation. Making good visuals (for these purposes)
means constructing them in a way that complements our perceptual system and
avoids extraneous features that carry no informational load. It is also
important to maximise the congruence between the visual data and the
ŇunderlyingÓ non-visual representation. For instance, in the diagram above I
may have distorted the data by choosing to assign one ● for each letter,
rather than for each word. Thus ●●●●●●●●
is not more of a noun than
●●●, but the visual representation gives the
impression to the viewer that it isŃbecause the length of words is encoded as
well as the part-of-speech information. On the other hand, ●●●●●●●● is
a ŇheavierÓ noun than ●●●,
and so if we wish to convey something about the density of a text then the
part-of-speech/word length combination may be appropriate.
I would obviously be pleased to create examples in which visualisation
facilitates all aspects of the analysis of texts. For this, I see no other way
forward than to work with different people in the humanities to see if I can
provide suggestive, and ultimately insightful, visualisations of texts they
regularly work with.
Today, graphical representations are widely used in general and
specialised media to render in a very useful and natural way certain kinds of
informationŃespecially changes in a variable over time. Given the naturalness
of visual information, it comes as a surprise to find just how recent graphical
representations of any kind are. It was not until the late eighteenth century
that time-series plots (graphs with a time dimension on the x-axis) began to be
used in scientific descriptions (Tufte 1983: 29). In 1765 Lambert described the
use of a relational graph in which two variables (not including time) were
plotted in relation to one another (Tilling 1975; Tufte 1983: 45). Today
graphical representations are common and appear to us to be transparent
representations, but the progression from spatial (cartographic)
representations to time-based graphs and then to non-temporal non-spatial
representations took place rather slowly. Some visual interfaces may seem
strange initially, but if they are reasonably well designed, they will soon be
treated as very natural and almost transparent, as we have all experienced with
the computer desktop metaphor, which some users may even feel to be a direct
representation of the workings of the personal computer.
In presenting the searches and graphical representations above, I may
have given the impression that what I am proposing is a technology project,
dealing essentially with technical or computational problems. This is not at
all the case. I do not need time and space and a community to work out how to
get a text to show hapax legomena in
a red font. That is not something I have to grapple with. The problems to be
faced are conceptual, not computational. What, for instance, is a text? How
should a text be represented visually: as a two-dimensional physical object,
perhaps, with representations of pages; or as a uni-dimensional object
consisting of a string of characters; or as an abstract object viewed in terms
of relations among words or relations among words and annotations? I have to
evaluate the consequences of adopting different models and while I do not
necessarily have to adopt a single representation of a text, I do have to
assess the usefulness of visualisations based on different ŇviewsÓ of a text.
Another major conceptual problem is how to deal with different kinds of
text mark-up. Humanities scholars have been heavily involved in the design and
use of annotation schemes such as the Text Encoding Initiative and XML.[6]
All digital texts contain some annotations and many contain numerous layers of
mark-up. Clearly, a text analysis program must distinguish the mark-up from the
text. But do we need to make a distinction between different types of mark-up?
Should we try to distinguish mark-up that is representational from mark-up that
is interpretive? The end result is obvious: a good text visualisation program
should be able to work with a complex annotation scheme to provide the user
with different views of a text on demand.
Notes
1. The version of this proposal posted here is now a slightly expanded version of the written proposal.
2. Bradley and RockwellŐs paper, in addition to describing themes in HumeŐs dialogues, talks explicitly about the advantages of visualisation as an analytical tool. They state (p4):
Visualization is É more than the representation of texts. Textual visualisation tools use graphical displays to help the user explore a text or corpus. Unlike systems that produce graphs as a result of text analysis, visualization tools allow one to use texts to do the text analysis. A visualization tool helps the user query a corpus, refine the query and understand the results quickly.
3. One might argue that the increased use of heavily annotated texts in
the humanities actually makes some kind of text visualisation software
necessary just to read the (underlying) text.
4. Following McKinnon, Bradley and Rockwell use Correspondence Analysis
to reduce word hyperspaces to produce Ňthemes.Ó Cluett places different
authors/texts within two coordinates based on linguistic features. Irizzary
physically changes the text in various ways to bring out different features.
Juillard and Luong use vector analysis to study similarities among a group of
lexemes in a text. Olsen, noting (p312) that the Ňcomplexities of text and
language have eluded simple measures based on word frequencies or content
analysisÓ, suggests the adoption of a semiotic approach. See Henry (1993) for
an alternative cognitive view.
Parunak displays lexical density scores at different locations.
Galloway uses multidimensional scaling techniques to produce ŇmapsÓ that
represent the movement of the characters. Phelan looks at the distribution of
selected words (such as pitee) within
and across texts.In addition, Smith (1989) examines themes (based on fire
and water) by examining the frequency of theme words (per 500 words) across a text and also
by using Fourier analysis on the frequency distribution by using state diagrams to map
the transitions between themes; and by using a three-D contour mapping system CGAMS to achieve
a similar result. Ross (1989) discusses the ratio of different parts-of-speech revealed by regression analysis in poetry over several centuries (following Miles 1964).
5. A review of MonoConc is posted at
http://linguistlist.org/issues/11/11-1411.html.
6. In particular, C. M. Sperberg-McQueen and Lou Burnard. The TEI homepage
is at http://www.hcu.ox.ac.uk/TEI/.
Barlow, Michael. 1997.
'Corpus Linguistics and the Study of Culture.' Proceedings of the Conference on Linguistics and Culture. Osaka,
Japan: University of Osaka, Japan.
Barlow, Michael. 2000. MonoConc Pro (Concordance software).
Houston: Athelstan.
Bradley, John and Geoffrey
Rockwell. 1994. 'What Scientific Visualization Teaches us about Text Analysis.'
Presented at the ALLC/ACH conference in Paris.
Bradley, John and Geoffrey
Rockwell. 1996. 'Watching Scepticism: Computer Assisted Visualization and
HumeŐs Dialogues.' In Giorgio
Perissinotto (ed), Research in Humanities
Computing, 5. Clarendon Press: Oxford, 32-47.
Burton, D. M. 1981.
'Automated Concordances and Word Indexes: the Fifties.' Computers and the Humanities 15, 1 1-14.
Card, Stuart K., Jock D.
Mackinlay and Ben Shneiderman. 1999. 'Information Visualization.' In Card,
Mackinlay and Shneiderman (eds), Readings
in Information Visualization: Using Vision to Think 1-34.
Chaucer, Geoffrey. The Canterbury Tales
http://etext.lib.virginia.edu/
Cluett, Robert.
1971. 'Style, Percept, Personality: A Test Case (Thomas Sprat 1635-1713).' Computers and the Humanities 5, 5,
257-277.
Galloway,
Patricia. 1979. 'Producing Narrative Maps with Multidimensional Scaling
Techniques.' Computers and the Humanities
13, 207-222.
Henry, Charles.
1993. 'The Surface of Language and Humanities Computing.' Computers and the Humanities 27, 315-322.
Hodges, Laura F.
2000. Chaucer and Costume: The Secular
Pilgrims in the General Prologue. Cambridge: Brewer.
Irizarry, Estelle. 1996. 'Tampering with the Text to Increase Awareness of Poetry's Art.' Literary and Linguistic Computing 11, 4, 155-162.
Juillard, M. M. A. and N. X. Luong. 1996. 'New Maps of Text: A New Way to Account for the Distribution of Lexemes in Texts.' ALC-ACH Ő96 Abstracts 157-158.
Miles, Josephine. 1964. Eros and Modes in English Poetry Berkeley/Los Angeles: University of California Press.
Olsen, Mark. 1993. 'Signs, Symbols and Discourses: A New Direction for Computer-Aided Literature Studies.' Computers and the Humanities 27, 309-314.
Parunak, H. Van Dyke. 1981.
'Prolegomena to Pictorial Concordances.' Computers
and the Humanities 15, 15-36.
Phelan, Walter S. 1978. 'The
Study of Chaucer's Vocabulary.' Computers
in the Humanities 12, 61-69.
Rohrer, Randall, David Ebert
and John Sibert. 1998. 'The Shape of Shakespeare: Visualizing Text Using
Implicit Surfaces.' Proceedings of the
IEEE Symposium on Information Visualization.
Ross Jr., Donald. 1989. 'Differences, Genres, and Influences.' In R. Potter (ed) Literary Computing and Literary Criticism Philadelphia: University of Pennsylvania Press. 45-59
Smith, John B. 1989. 'Computer Criticism' In R. Potter (ed) Literary Computing and Literary Criticism Philadelphia: University of Pennsylvania Press. 13-44
Tilling, Laura. 1975. 'Early Experimental Graphs.' British Journal for the History of Science, 8 193-213.
Tufte, Edward R. 1983. The Visual Display of Quantitative Information. Cheshire, CT: Graphics Press.
Unsworth, John, Deborah Parker and Dan Ancona. 1998-. 'A Visualization of Dante's Inferno.' http://urizen.village.virginia.edu/hell/